This post is short and sweet.
I’m going to build off of my previous post, where you learned how to customize fonts by extending the default theme with a custom Sass file. Here, you will learn how to style a table in your Quarto presentation by adding a container for your tables in the Sass file.
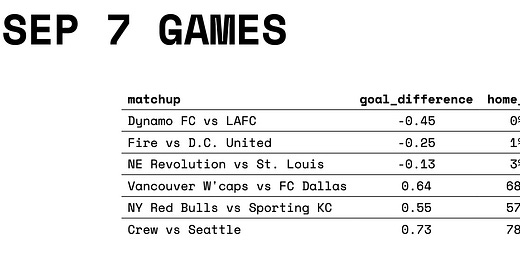
As an example, I’ll show you how to style a table with this weekend’s ⚽️ MLS match predictions1. The basic code we are going to start with only defines the slide title and adds a simple table with minimal formatting:
## SEP 7 GAMES

```{r}
my_table %>%
  kbl(align = "lccc")
```
Your Table Probably Doesn’t Fit in the Slide
The first few times that you add tables to a Quarto presentation, you are going to run into issues with their size and display. For example, my first attempt rendering the match predictions table resulted in an oversized table.
So what can we do to fix this?
We can create a container for all tables in your presentation. This container will define things like font sizes and the position of the table. A single container can be used for different tables, giving them a uniform style.
Create a Container
In your custom Sass file, you can add a container (technically, a class) for your tables using code like this:
 .table-grid {
    font-family: Space Mono;
    font-size: 14pt;
    position: relative;
    top: 40px;
    left: 40px;
 }
In this example, the container is named table-grid and it controls the font family and size, as well as the position of the table in the slide.
Then, all you need to do is wrap the table’s code chunk with your container and voila!
## SEP 7 GAMES

::: table-grid
```{r}
my_table %>%
  kbl(align = "lccc")
```
:::
The table now fits the slide 🏆.
And this is one of those awesome things about Quarto. You can leverage the power of Sass to customize many other aspects of your tables, as well as many other types of content in your presentations! You can create containers for figures, slides where the text needs to look different than regular text, and many other things!
Was this post useful? Let me know in the comments and share it with anyone who’s getting started with Quarto.
Coming up in this series: styling plots, printing to PDF, and much more!
I’m playing with different models to predict the goal difference in each match. On this table, a positive goal difference means the home team is expected to win. The upset column is the probability that the away team wins the match. Do you want to learn more about this model and its predictions? Let me know in the comments!


